It’s July 26, 2025, and the cryptocurrency market continues to be a dynamic space. Many new traders jump in, often relying on hype or intuition. But if you’re serious about navigating this market effectively, it’s time to focus on data. My own journey from corporate finance to independent trading has hammered home one principle: data-driven decisions outperform gut feelings every time.
So, how do we apply this to cryptocurrency trading? Let’s break down a couple of data-centric strategies.
1. Moving Average Crossovers
This is a classic technical analysis tool, but its effectiveness in crypto is notable. A moving average smooths out price data to create a single, lagging indicator. When a shorter-term moving average crosses above a longer-term one, it’s often seen as a bullish signal (a potential buy opportunity). Conversely, when the shorter-term average crosses below the longer-term one, it can signal a bearish trend (a potential sell signal).
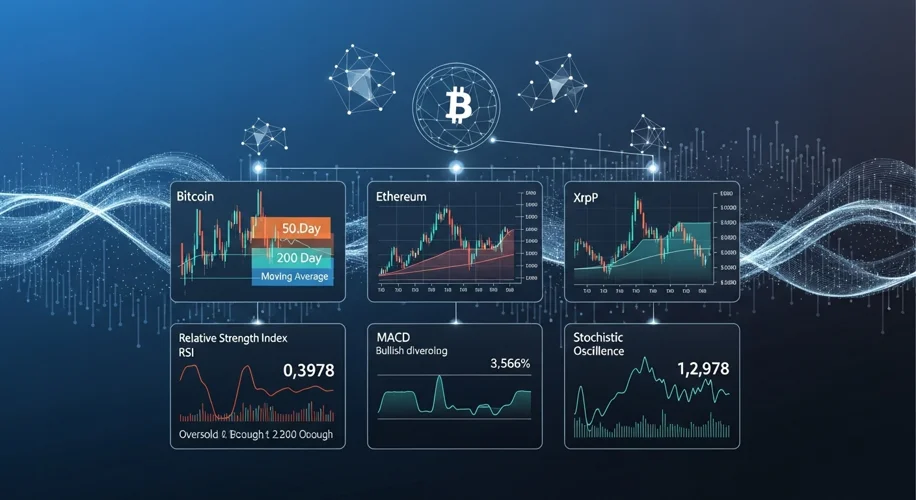
For example, using a 50-day moving average (MA) and a 200-day MA on Bitcoin (BTC) charts. If the 50-day MA crosses above the 200-day MA, traders might see this as a sign that upward momentum is building. The inverse is true for a bearish signal. The key here is to look at the volume accompanying these crossovers. High volume on a crossover can validate the signal. You’re not just looking at the lines on a chart; you’re looking at confirmation.
2. Relative Strength Index (RSI) for Overbought/Oversold Conditions
The RSI is a momentum oscillator that measures the speed and change of price movements. It oscillates between 0 and 100. Traditionally, an RSI reading above 70 suggests an asset is overbought (potentially due for a price correction), and a reading below 30 suggests it’s oversold (potentially due for a bounce).
In the volatile crypto market, these levels might need slight adjustment. Some traders find that levels like 80 for overbought and 20 for oversold are more reliable indicators for certain cryptocurrencies. It’s crucial to observe how different assets behave. For instance, if Ethereum (ETH) consistently stays in overbought territory for extended periods during a strong bull run, simply selling when the RSI hits 70 might mean missing out on further gains. The data here tells you to combine RSI with other indicators or trend analysis rather than using it in isolation.
3. Volume Analysis
Volume is the bedrock of many trading strategies. It indicates the number of units traded during a specific period. High volume confirms price action. If Bitcoin’s price surges on low volume, it might not be a strong indicator of sustained upward movement. However, if the price rises on significantly higher than average volume, it suggests strong conviction behind the move.
Consider analyzing volume spikes in relation to price action. A sharp increase in volume during a price drop could indicate capitulation, where many holders are selling, potentially creating a bottom. Conversely, a volume spike accompanying a price increase can signal strong buying interest.
Putting it Together
These are just a few examples. The real power comes from combining them. For instance, you might look for a bullish moving average crossover and an RSI reading moving out of oversold territory, confirmed by an increase in trading volume. This layered approach filters out weaker signals and increases the probability of successful trades.
The cryptocurrency market will always have its share of unpredictability. But by anchoring your decisions in observable data – price action, volume, and established technical indicators – you can build a more robust and rational trading framework. Stop trading on emotion. Start trading on data.
Disclaimer: This post is for informational purposes only and does not constitute financial advice. Trading cryptocurrencies involves significant risk.

